2 minute read / Jul 17, 2023 /
Producing Charts with AI
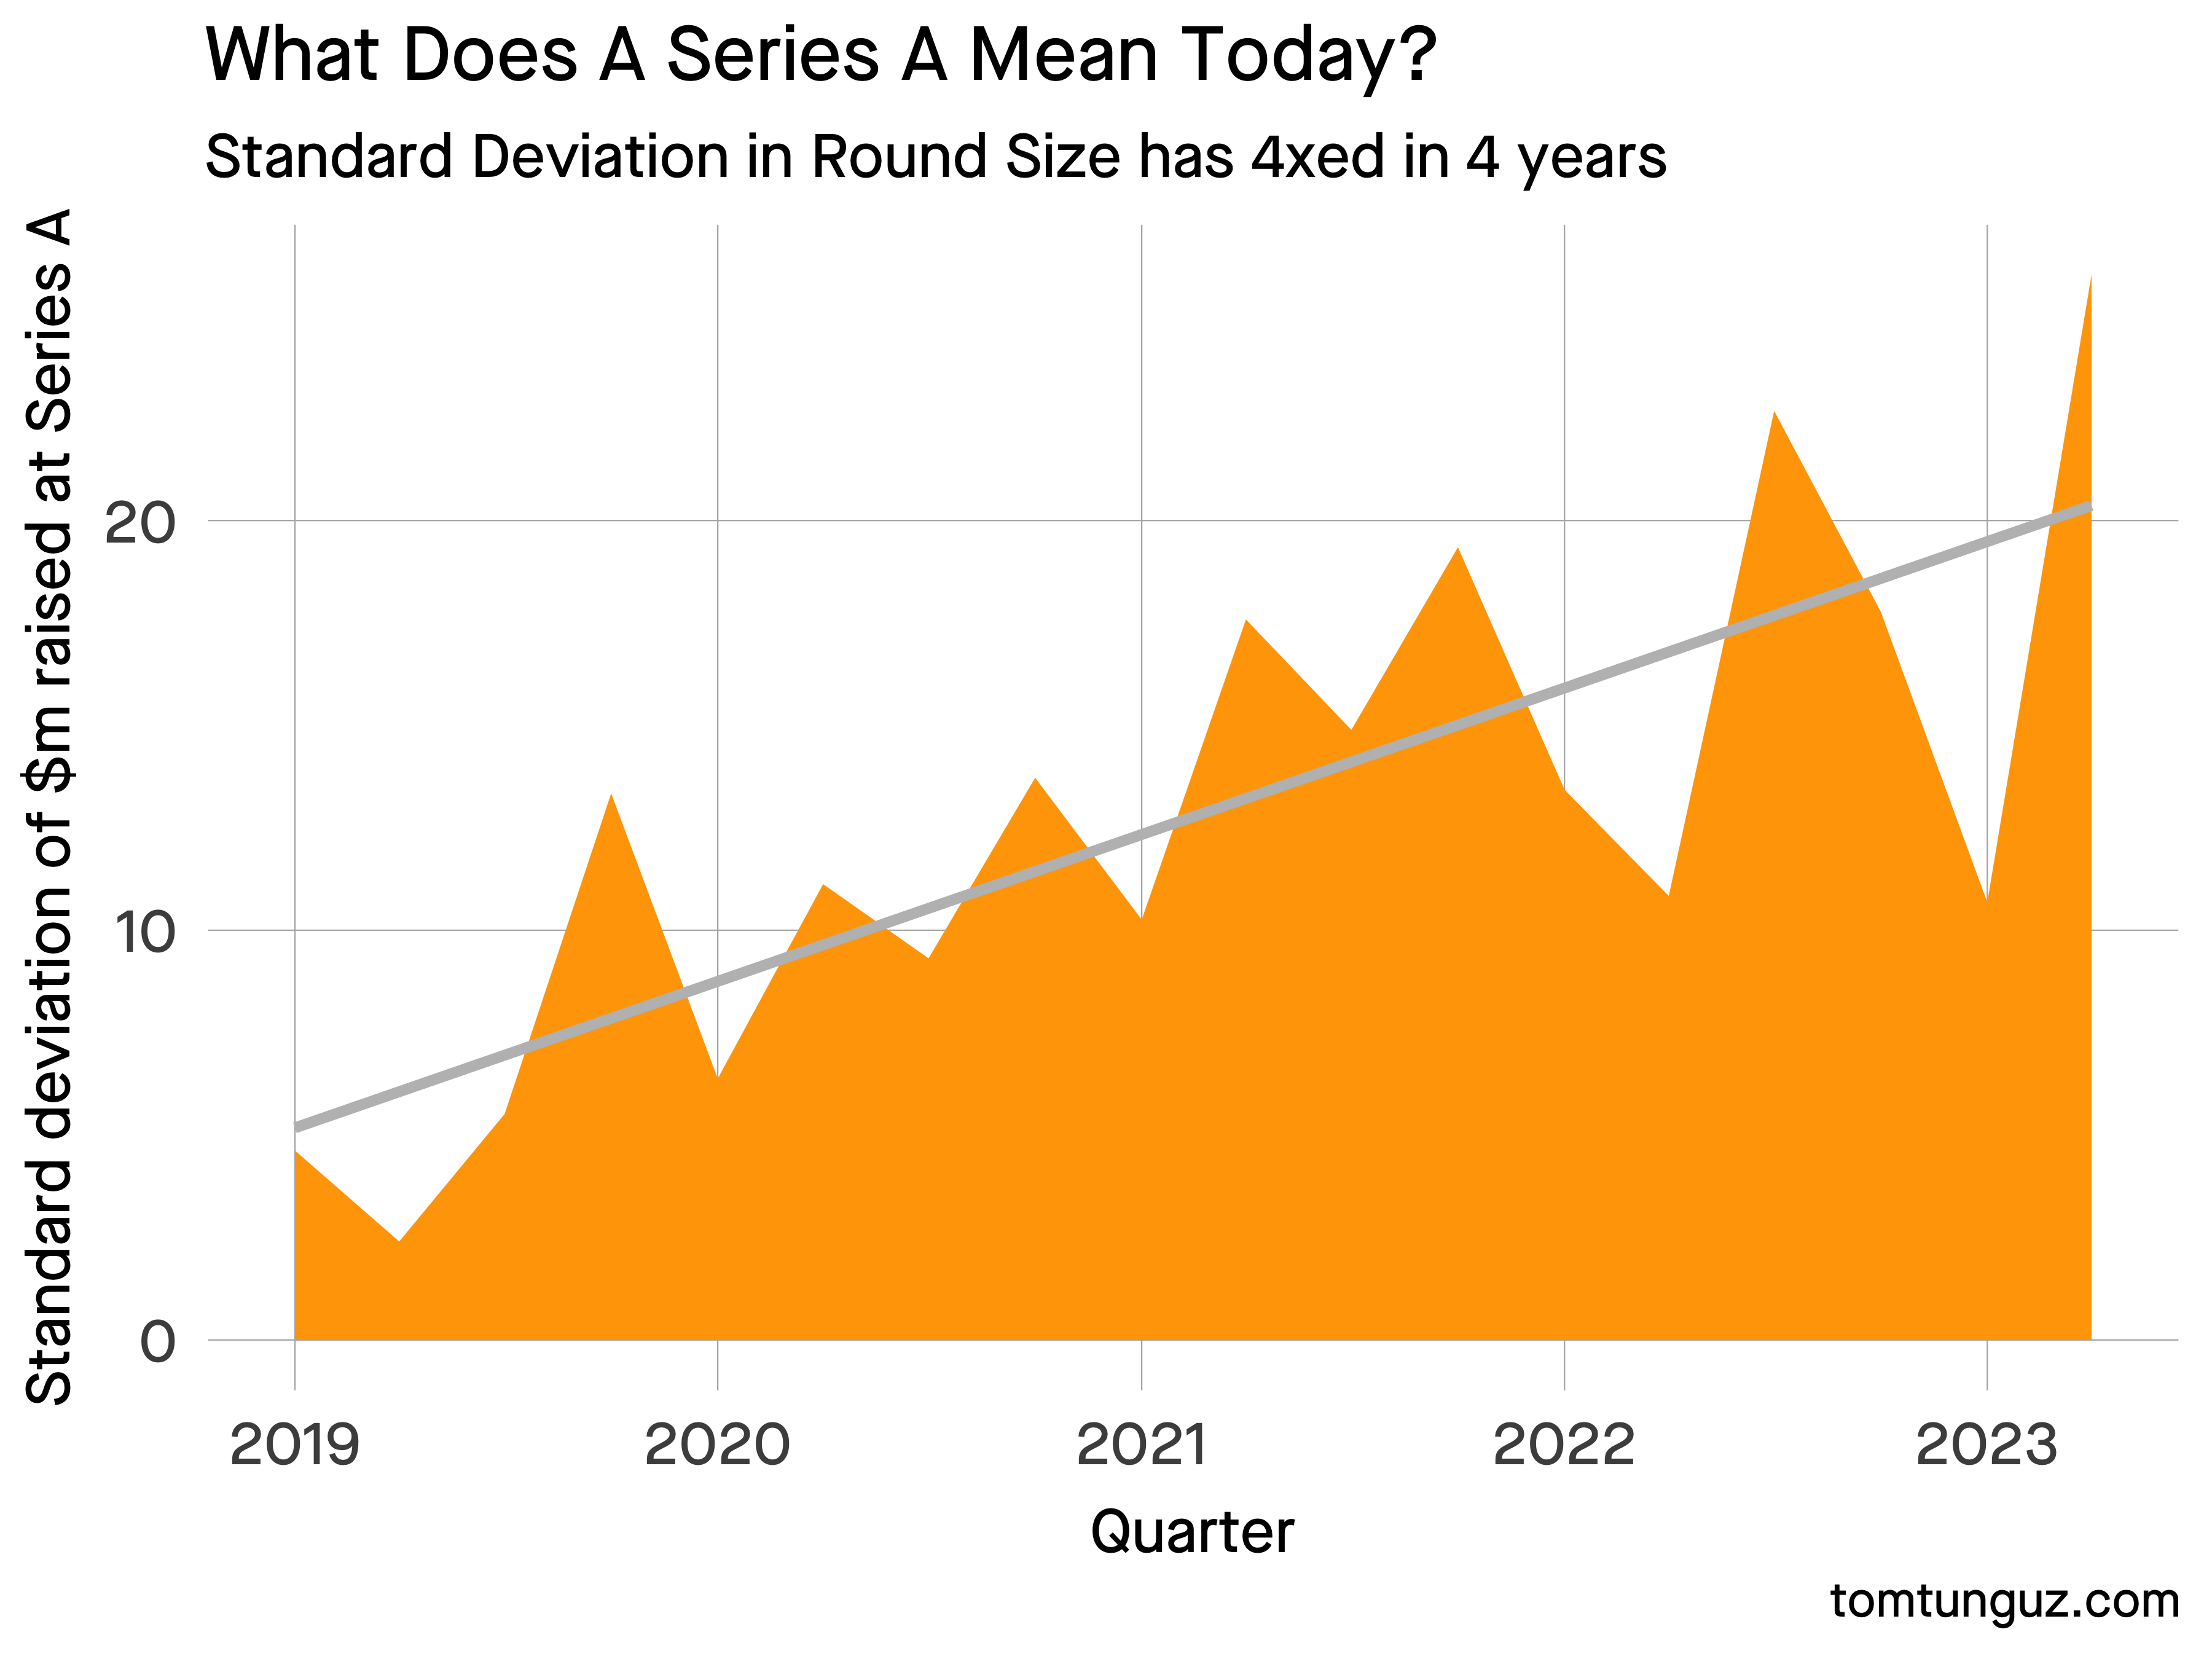
Last Monday, I published a chart that looked like this. It shows the standard deviation in Series A round sizes over time. I needed about 20 minutes using a language called R to create it.
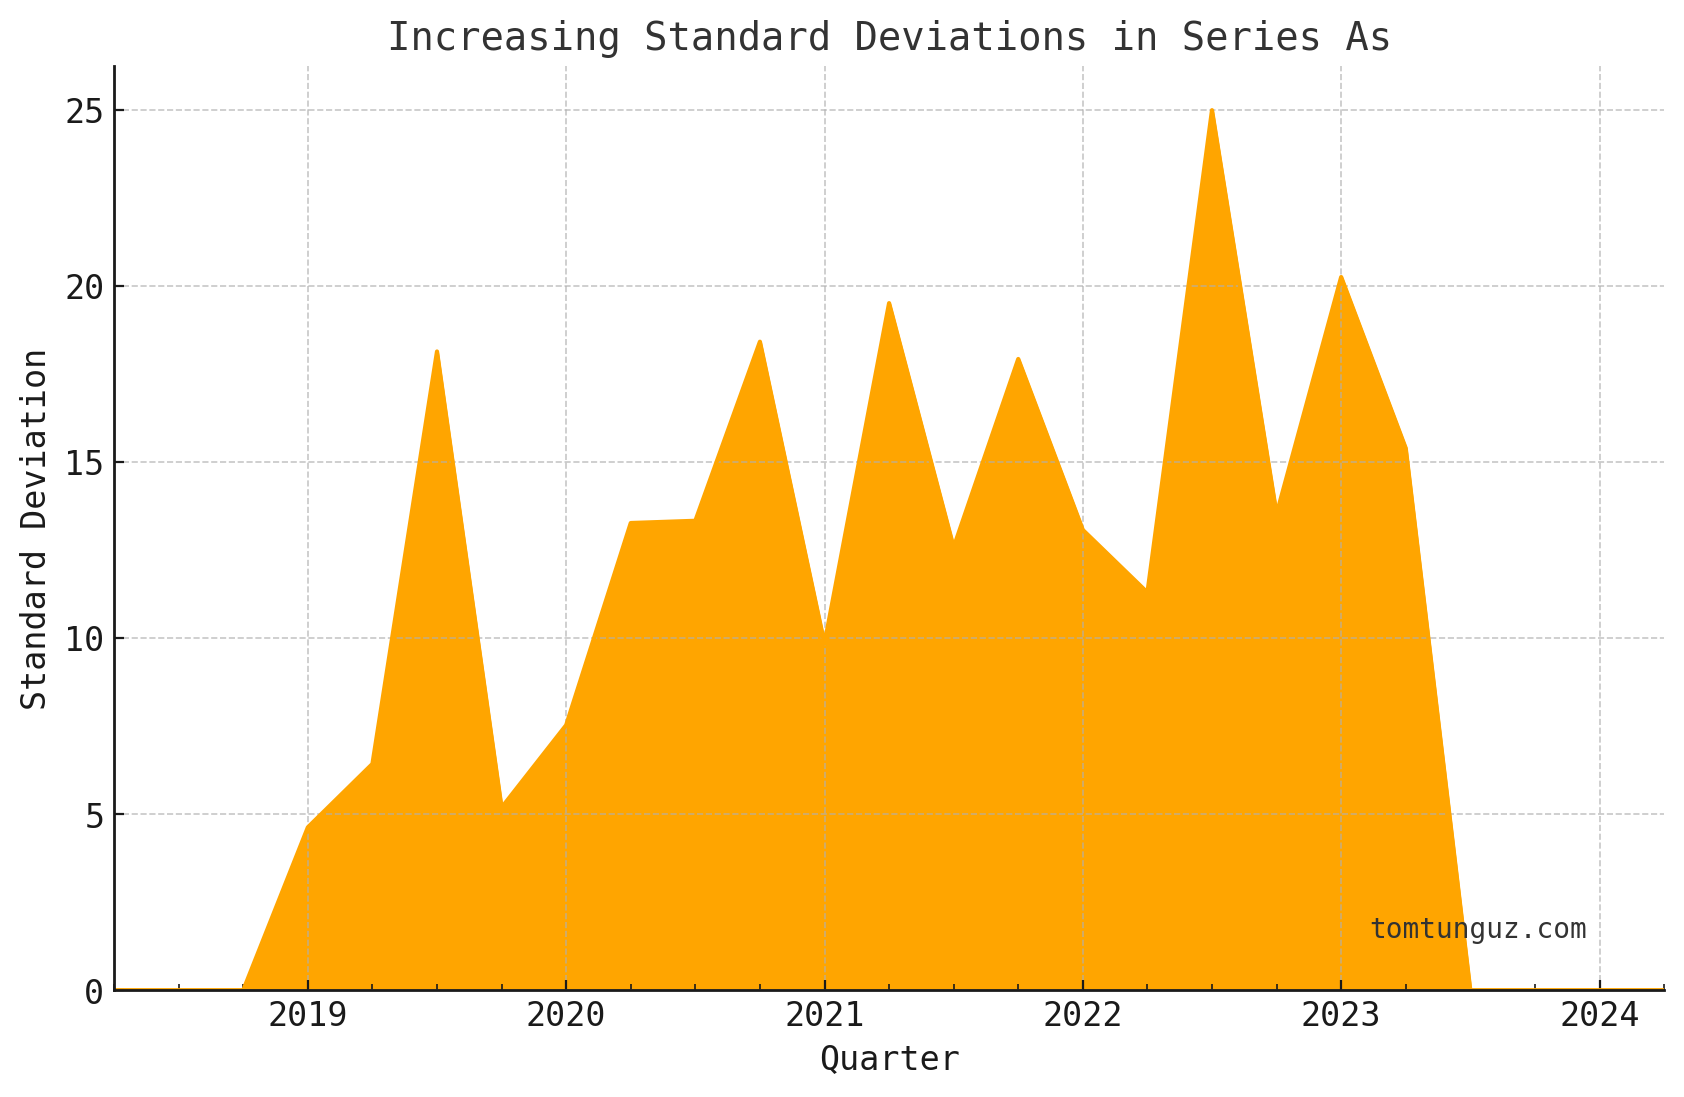
Then I tried to replicate it using ChatGPT3’s Code Interpreter feature & I spent less than 5 minutes duplicating it, most of the time waiting for the computer (see video at the end of the post).
There’s a lot to like about using Code Interpreter.
First, I can describe my ideal chart in English. When ChatGPT finds formatting foibles in the data, it fixes them. My columns contained extra spaces.
Second, the computer determines which libraries to use & installs them, so I stop worrying about my environment.
Last, I can perform statistical analysis like testing for significance, Anova, & correlation just by asking. The robot will explain the test, the rationale for the test, & conditions for when the test works. I can forget about syntax arcana of a particular student T-test library.
For me, this is the power of LLMs. Analysts operate at a higher plane of abstraction & compress the amount of time to achieve an output.
It’s not perfect. I spend most of the time waiting for the computer to return after a query. It’s unclear how to replicate or share the analysis if I needed to because the session doesn’t store the data file & it’s not linked to Github.
But, these features will surely be implemented in the future by SaaS startups.
Here’s the video of my session with ChatGPT.